使用jmh进行基准测试
什么是基准测试
基准测试是指通过设计科学的测试方法、测试工具和测试系统,实现对一类测试对象的某项性能指标进行定量的和可对比的测试。
java基准测试工具jmh
官方介绍
JMH is a Java harness for building, running, and analysing nano/micro/milli/macro benchmarks written in Java and other languages targetting the JVM.
使用官网mvn骨架工程创建项目
命令行方式
mvn archetype:generate
          -DinteractiveMode=false
          -DarchetypeGroupId=org.openjdk.jmh
          -DarchetypeArtifactId=jmh-java-benchmark-archetype
          -DarchetypeVersion=1.21
          -DgroupId=io.docbot
          -DartifactId=jmh-example
          -Dversion=1.0-SNAPSHOT
          -DarchetypeCatalog=https://maven.aliyun.com/repository/public/archetype-catalog.xml
idea方式
idea新建maven项目并添加骨架类型
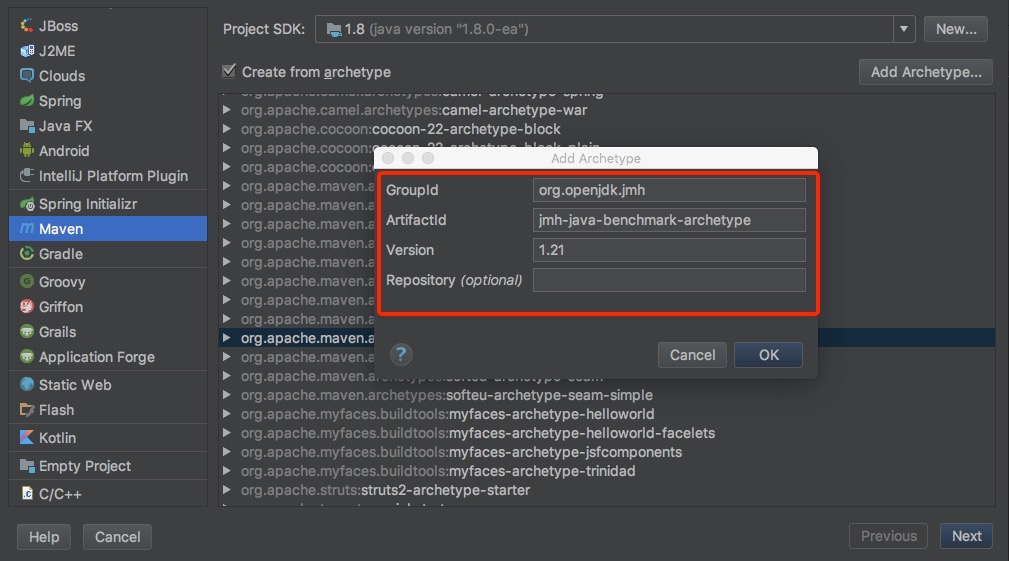
填写必要的项目信息
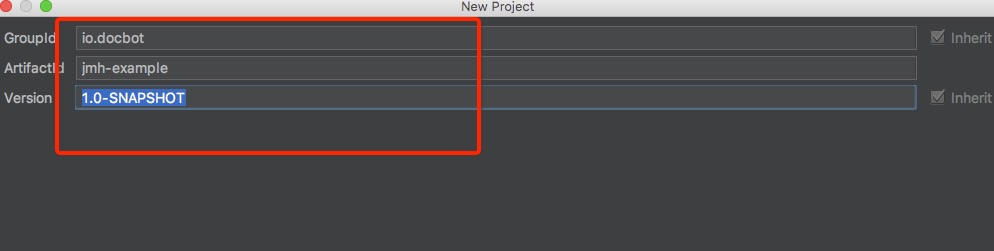
第一个例子
package io.docbot;

import org.openjdk.jmh.annotations.Benchmark;
import org.openjdk.jmh.annotations.BenchmarkMode;
import org.openjdk.jmh.annotations.Mode;
import org.openjdk.jmh.annotations.OutputTimeUnit;
import org.openjdk.jmh.runner.Runner;
import org.openjdk.jmh.runner.RunnerException;
import org.openjdk.jmh.runner.options.Options;
import org.openjdk.jmh.runner.options.OptionsBuilder;

import java.util.concurrent.TimeUnit;

public class MyBenchmark {

    @Benchmark
    @BenchmarkMode(Mode.AverageTime)
    @OutputTimeUnit(TimeUnit.MILLISECONDS)
    public void testMethod() {
        try {
            Thread.sleep(500);
        } catch (InterruptedException e) {
            // ignore
        }
    }
    public static void main(String[] args) throws RunnerException {
        Options opt = new OptionsBuilder()
                .include(MyBenchmark.class.getSimpleName())
                .forks(1)
                .build();

        new Runner(opt).run();
    }
}
执行结果:
# JMH version: 1.21
# VM version: JDK 1.8.0-ea, Java HotSpot(TM) 64-Bit Server VM, 25.0-b53
# VM invoker: /Library/Java/JavaVirtualMachines/jdk1.8.0.jdk/Contents/Home/jre/bin/java
# VM options: -javaagent:/Applications/IntelliJ IDEA.app/Contents/lib/idea_rt.jar=49622:/Applications/IntelliJ IDEA.app/Contents/bin -Dfile.encoding=UTF-8
# Warmup: 5 iterations, 10 s each
# Measurement: 5 iterations, 10 s each
# Timeout: 10 min per iteration
# Threads: 1 thread, will synchronize iterations
# Benchmark mode: Average time, time/op
# Benchmark: io.docbot.MyBenchmark.testMethod

# Run progress: 0.00% complete, ETA 00:01:40
# Fork: 1 of 1
objc[47205]: Class JavaLaunchHelper is implemented in both /Library/Java/JavaVirtualMachines/jdk1.8.0.jdk/Contents/Home/jre/bin/java and /Library/Java/JavaVirtualMachines/jdk1.8.0.jdk/Contents/Home/jre/lib/libinstrument.dylib. One of the two will be used. Which one is undefined.
# Warmup Iteration   1: 503.620 ms/op
# Warmup Iteration   2: 506.203 ms/op
# Warmup Iteration   3: 502.906 ms/op
# Warmup Iteration   4: 502.969 ms/op
# Warmup Iteration   5: 503.095 ms/op
Iteration   1: 502.768 ms/op
Iteration   2: 502.063 ms/op
Iteration   3: 502.160 ms/op
Iteration   4: 502.267 ms/op
Iteration   5: 502.592 ms/op


Result "io.docbot.MyBenchmark.testMethod":
  502.370 ±(99.9%) 1.151 ms/op [Average]
  (min, avg, max) = (502.063, 502.370, 502.768), stdev = 0.299
  CI (99.9%): [501.220, 503.521] (assumes normal distribution)


# Run complete. Total time: 00:01:42

REMEMBER: The numbers below are just data. To gain reusable insights, you need to follow up on
why the numbers are the way they are. Use profilers (see -prof, -lprof), design factorial
experiments, perform baseline and negative tests that provide experimental control, make sure
the benchmarking environment is safe on JVM/OS/HW level, ask for reviews from the domain experts.
Do not assume the numbers tell you what you want them to tell.

Benchmark               Mode  Cnt    Score   Error  Units
MyBenchmark.testMethod  avgt    5  502.370 ± 1.151  ms/op
支持的模式
@Inherited
@Target({ElementType.METHOD, ElementType.TYPE})
@Retention(RetentionPolicy.RUNTIME)
public @interface BenchmarkMode {

    /**
     * @return Which benchmark modes to use.
     * @see Mode
     */
    Mode[] value();

}- Throughput
Measures the number of operations per second, meaning the number of times per second your benchmark method could be executed.
- Average Time
Measures the average time it takes for the benchmark method to execute (a single execution).
- Sample Time
Measures how long time it takes for the benchmark method to execute, including max, min time etc.
- Single Shot Time
Measures how long time a single benchmark method execution takes to run. This is good to test how it performs under a cold start (no JVM warm up).
- All
Measures all of the above.
时间单位
@Inherited
@Target({ElementType.METHOD,ElementType.TYPE})
@Retention(RetentionPolicy.RUNTIME)
public @interface OutputTimeUnit {

    /**
     * @return Time unit to use.
     */
    TimeUnit value();

}
NANOSECONDS
MICROSECONDS
MILLISECONDS
SECONDS
MINUTES
HOURS
DAYS
如何给测试方法传递状态
@Inherited
@Target(ElementType.TYPE)
@Retention(RetentionPolicy.RUNTIME)
public @interface State {

    /**
     * State scope.
     * @return state scope
     * @see Scope
     */
    Scope value();

}- Thread
Each thread running the benchmark will create its own instance of the state object.
- Group
Each thread group running the benchmark will create its own instance of the state object.
- Benchmark
All threads running the benchmark share the same state object.
状态类的要求
- The class must be declared public
- If the class is a nested class, it must be declared static (e.g. public static class …)
- The class must have a public no-arg constructor (no parameters to the constructor).
状态对象的@Setup和@TearDown
@Target(ElementType.METHOD)
@Retention(RetentionPolicy.RUNTIME)
public @interface Setup {

    /**
     * @return Level of this method.
     * @see Level
     */
    Level value() default Level.Trial;

}
@Target(ElementType.METHOD)
@Retention(RetentionPolicy.RUNTIME)
public @interface TearDown {

    /**
     * @return At which level to run this fixture.
     * @see Level
     */
    Level value() default Level.Trial;

}- Level.Trial
The method is called once for each time for each full run of the benchmark. A full run means a full “fork” including all warmup and benchmark iterations.
- Level.Iteration
The method is called once for each iteration of the benchmark.
- Level.Invocation
The method is called once for each call to the benchmark method.
例子:
package io.docbot;

import org.openjdk.jmh.annotations.*;
import org.openjdk.jmh.runner.Runner;
import org.openjdk.jmh.runner.RunnerException;
import org.openjdk.jmh.runner.options.Options;
import org.openjdk.jmh.runner.options.OptionsBuilder;

public class MyStatesBenchmark {
    @State(Scope.Benchmark)
    public static class BenchmarkState {
        volatile double x = Math.PI;
        @Setup(Level.Trial)
        public void doSetup() {
            System.out.println("Do Setup");
        }

        @TearDown(Level.Trial)
        public void doTearDown() {
            System.out.println("Do TearDown");
        }
    }

    @State(Scope.Thread)
    public static class ThreadState {
        volatile double x = Math.PI;
        @Setup(Level.Iteration)
        public void doSetup() {
            System.out.println("Do Setup");
        }

        @TearDown(Level.Iteration)
        public void doTearDown() {
            System.out.println("Do TearDown");
        }
    }
    @Benchmark
    public void measureUnshared(ThreadState state) {

        state.x++;
    }

    @Benchmark
    public void measureShared(BenchmarkState state) {

        state.x++;
    }
    public static void main(String[] args) throws RunnerException {
        Options opt = new OptionsBuilder()
                .include(MyStatesBenchmark.class.getSimpleName())
                .threads(4)
                .forks(1)
                .build();

        new Runner(opt).run();
    }
}更多参考JMH samples
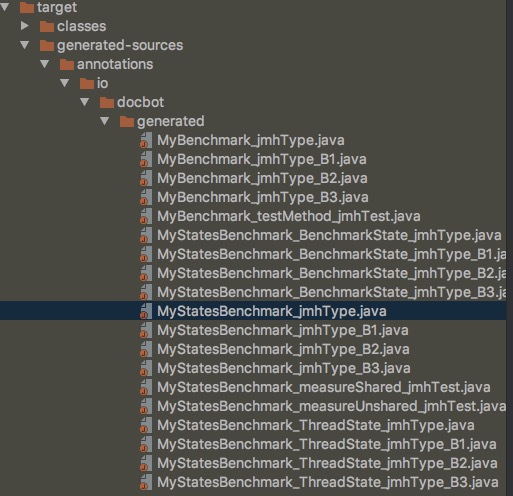
jmh内部是如何实现的呢?
在学习的过程中发现jmh使用了java的注解处理器来生成代码